This tutorial will help you create accessible tables in Microsoft Word and other Office products, like PowerPoint.
Page Contents
First, we’ll show you how to insert a table object, then set up a header row so your table is accessible to all of your students.
Data Tables
Data tables display information in a grid or matrix. They contain header columns and/or rows that explain what the information in the grid means.
Figure 1 shows a simple data table created in Microsoft Word with a style you can find on the Design tab.
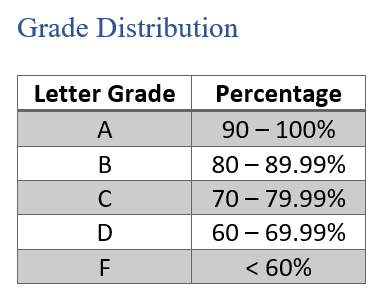
Sighted students can scan tables to make associations between data in the table and their corresponding headers. Screen readers can provide those associations for your students, but only if you create accessible tables.
At this time, Word only supports column headers. However, both column and row headers are supported in HTML.
How to Create Accessible Tables
Table Guidelines
Follow these guidelines in order to create accessible tables:
- Tables should be used for data only, not for layout.
- Make tables as simple as possible — they should have no merged or split cells.
- Complex tables should be broken down into multiple simple tables.
- Tables in Word should always contain a header row.
- Table rows shouldn’t split across multiple pages.
- Tables should include Alt Text to describe its content or structure for those who cannot see it.
These guidelines can easily be met if you adhere to the following instructions.
Insert a Table into Word
To insert a table in Word, do the following:
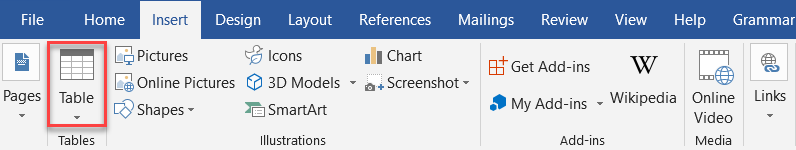
- Choose Insert > Table to insert a table.

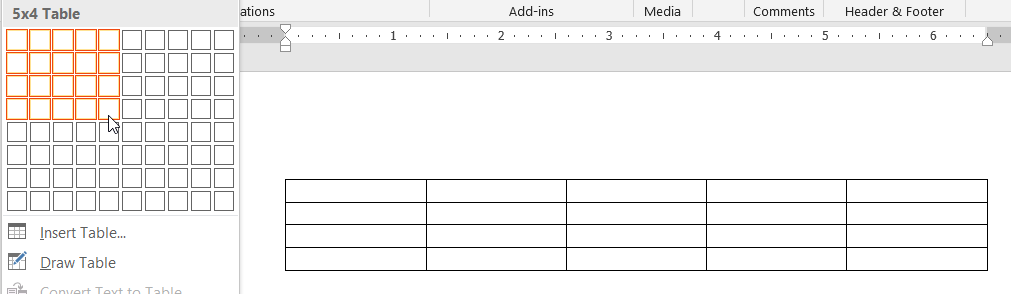
Figure 2. Insert the table into your document. - Choose the size of your table. Boxes across are your columns, and boxes down are your rows.
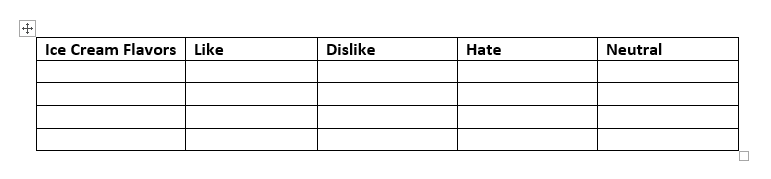
Figure 3. Choosing 5 columns across and 4 rows down will result in the displayed table. Do NOT use the Draw Table feature. This feature will not create an accessible table. - Type column headings into the first row of your table.
Figure 4. The first row of the table should now contain your column headings.
Set Table Headers and Properties
Once you’ve inserted a table and its column headings, you should set your first row to a header row.
Make the first row a header row by following these steps:
- Select the entire first row of your table.
- Right-click the row and select Table Properties from the resulting context menu.
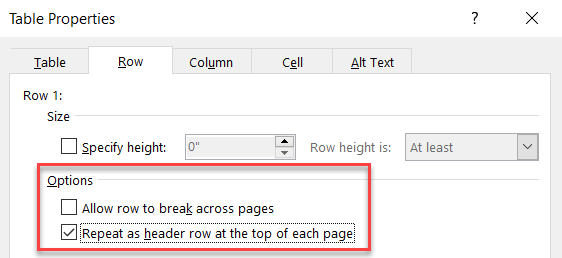
- On the Table Properties > Row tab:
- Uncheck Allow row to break across pages.
- Check Repeat as header row at the top of each page.
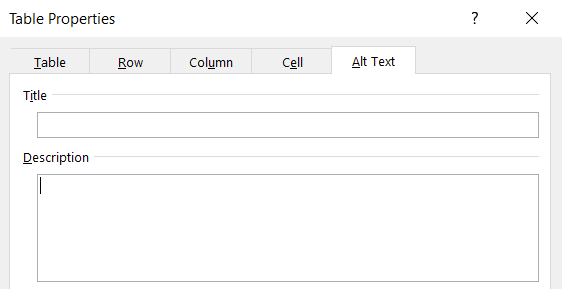
Figure 5. The Row tab within Table Properties. - On the Table Properties > Alt Text tab:
- In the Description area, write a summary of your table’s structure or content.
- Leave the Title field blank.
Figure 6. The Alt Text tab within Table Properties. - Click OK.
Whoop! Now you’ve got yourself an accessible table!
Using Spaces to Emulate a Table is Not Accessible
Never display data using spaces instead of a table object. Not only is this potentially confusing for sighted students (lacking borders, and potentially, alignment), but it could be difficult or impossible to understand for students using a screen reader.
An Example
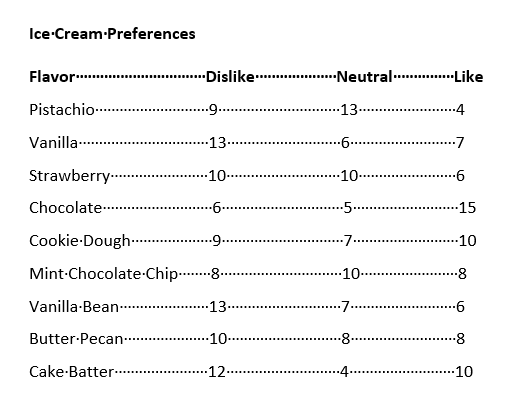
For example, here is a spaced “table.” While sighted students may find this easily understandable, it’s something else entirely for those using a screen reader. Note: The dots represent spaces.
Screen readers would read this content from top-to-bottom, left-to-right:
Confusing, isn’t it?
WebAIM’s Creating Accessible Tables intro has another scary example.
Tables Made with Spaces Exclude Crucial Information
Because a table object isn’t used, students will be missing crucial information. Consequently, students won’t know this is a table, nor would they know that “flavor,” “dislike,” “neutral,” and “like” are headers.
Even if students figure out this is a table, they may quickly forget which “header” corresponds to each piece of data; it would likely require repeated listening to understand.
If you use a table object instead (with a screen reader):
- Students will hear when they’ve encountered a table.
- Column headers will be read aloud when they are tabbed through.
- When tabbing to a data cell, screen readers will state the corresponding header (e.g., “Flavor”), then state the table cell’s value (e.g., “Vanilla”).
- Students can skip from table to table using their screen reader’s keyboard shortcuts.
Using a table object ensures all students can access the data within your table equivalently.
Conclusion
Creating accessible tables your students can access and understand is essential, so everyone has the same opportunity to perform well in your course. Inserting a simple table and setting up appropriate table headers and properties goes a long way to ensure your students can equitably receive your content.

Leave a Reply